
As Stephen Few, Data Visualization expert said “Numbers have an important story to tell. They rely on you to give them a clear and convincing voice.” Data storytelling is a way to narrate your insights effectively by giving a voice to your data. Data storytelling is a key that will allow individuals to understand complex aspects from the findings of data analysis, help them solve the problem, and react appropriately against the issues. Data storytelling is the most important part of data analytics and is used in convincing the audience. Data without a story doesn’t have any meaning and value.
Data storytelling merges three fields of expertise, namely Data, visuals, and narrative. The interaction and cooperation of these elements are essential and work simultaneously in data storytelling. When narration is synced with data, it explains; rather helps the audience form a picture of what is happening in the data and why a certain insight is important. By applying visuals to data the audience can locate and understand stuff they wouldn’t have without charts or graphs. By combining these two, i.e. narrative and visuals, we can engage or probably even entertain the audience. That is to say on merging the right visuals and right narrative with the right data can provide us with a revolutionary data story.
Data storytelling many benefits of which the primary, important and game-changing ones include that you get to learn lots of your business; but the plot twist comes when we say all that in a very simple way, in a very understandable way, or simply like a story from the data you have. Moving on, with the help of a data story, you know where you stand and what you want. You do not deviate but are completely focused. Next up, data storytelling helps you prioritize your conversations and makes sure you don’t deviate from the key points. Further, the fact that data story uses plain, simple language to be able to express the data is a boon for you as you don’t have to spend your time explaining to other people who don’t understand the data what it is as the story does that all and you can invest and use this time wisely. Lastly, data storytelling saves you from a dilemma as it is already in a consumable form you don’t have to spend time on understanding, decoding, and stuff like that with the data anymore.
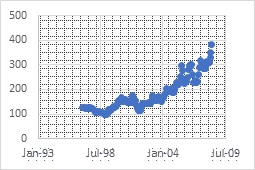
For example: If you consider this graph what you can comprehend from this is nothing because to understand this first we should know the simple statement “the data is about what” then by using the different tools of statistics we can interpret the data. Data and numbers need to be put in a proper context so that all can understand them. Data stories are helping the numbers to make sense to all of us.
Data storytelling finds its place in any field where data is used to present analysis or insights. May it be in annual reports, management information system reporting and analysis, business performance summary, operations performance summary, Investment analysis reports, and even students presentation. Data story finds its scope anywhere and everywhere there is a need to communicate the meaning behind a given set of data. Today Businesses produce tons of data that are very similar to the competitor’s data. Data storytelling allows us to use data more efficiently by giving us the ability to interpret it and convey its meaning in a more actionable and more powerful way thereby giving us the weapon to stand out from the rest.
Prof Roopa UAssistant Professor DSCE- MBA