
We turn knowledge into a world that may explore with our eyes by visualizing it. This is a kind of information map, and an information map comes in handy when you’re drowning in data. Data visualization is a graphical representation of information that shows patterns and trends while also allowing viewers to gain quick insights. You might use interactive visualization to drill down and segment the different areas of charts and graphs to receive a more complete study of the information being presented today, when technological discoveries are making waves in every market segment, big or little.
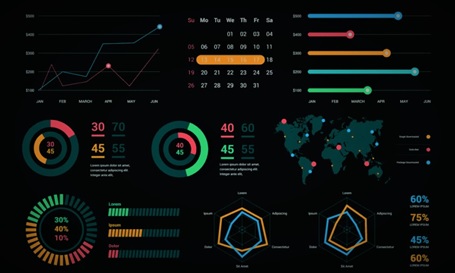
Source: https://www.datameer.com/blog/data-visualization
How data visualization helps investors?
Investing can be difficult no matter how much or how little knowledge you have in a certain field. At any given time, you’ll be dealing with hundreds of variables, thousands of potential options, and a cluster of holdings in your portfolio.
Decision fatigue can result from having access to all of this information while also trying to make new judgments on a regular basis, making it harder to locate the “correct” decision in any given pool of options. Data visualization, fortunately, may be able to assist.
How can you use data visualization to help you make better investment decisions?
Patterns are best presented through visuals. The human mind is wired to perceive patterns, but when those patterns emerge as individual data points, such as in stock prices that change over months, it’s difficult to make sense of them. When those data points are shown on a linear graph, though, it’s much easier to recognize the highs and lows, as well as make educated guesses about how that pattern might play out in the future. You can also use data graphics to highlight and control numerous variables. Depending on your objectives, this could help you consider numerous variables at once, or drill down to focus just on the effects of one variable on your investments. In either case, pictures can help you make better decisions.
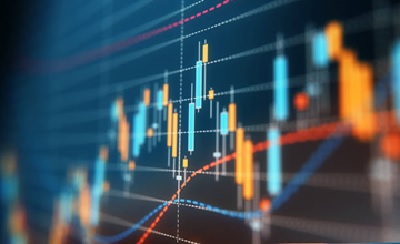
Source: https://media.istockphoto.com
Can Data Visualization Help You Maximize Your Investments?
Financial data has a well-deserved record for being complicated to understand. While Professional investors can easily read and analyze quarterly reports and fund performance measures, the bulk of individual investors and clients are not that skilled at reading and evaluating financials. This is where the use of charts comes into play. Financial charting is a significant tool for investors and organizations, since it allows them to compress key data for maximum impact. Charts can even go so far as to clearly set out a captivating, visually appealing financial statement based on the information acquired.
It’s incredibly tough to deliver crucial insights or highlight significant trends if you rely solely on statistics. To be of any real value to the great majority of clients and investors, the data must be structured and evaluated in a digestible manner. The most effective charts are those in which the data is presented in a way that helps the audience grasp the underlying numbers. This can significantly improve your audience’s capacity to absorb and interpret the information presented to them.
Design-forward charts
These charts are used to highlight contrasts, similarities, and trends within data sets. You’re giving your viewers a user-friendly, easy way to absorb the information by breaking down a vast quantity of data into a visual depiction of quantitative data. As a result, visual drawings enhance the fundamental message you’re attempting to deliver, resulting in a clearer financial picture, as well as the goodwill generated by exhibiting a focus on the user experience and devotion to your mission.
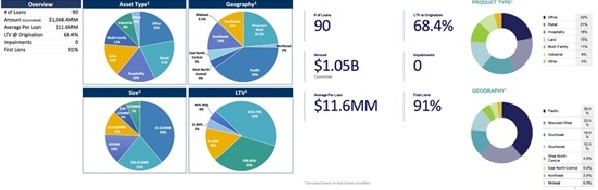
Source: https://mbcstrategic.com
Overall, data visualization can help you become a better investor as long as you understand the benefits and drawbacks of these visuals and can plan accordingly. Start visualizing your portfolio in more interactive graphs, and use the information you get, to make faster and more effective decisions.
KARTHIK P M & KRITHIK S
I MBA, DSCE