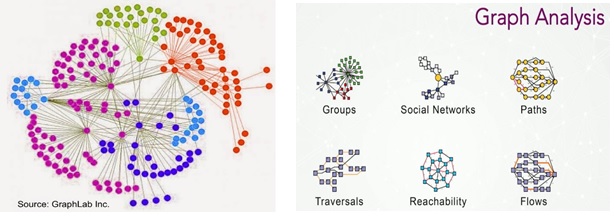
To know about what is Graph Analytics first we should know about what is Graph. The graph is a mathematical term that speaks about the relationship between the entities. The two elements which are used here are vertices or nodes and links or the edges. The study of graphs can also be called graph theory. Graph analytics can also be called a Graph algorithm, are the tools that are used to analyze the relationships and to determine the strength between the entities existing in an organization, such as customers, products, and services. These relationships are represented in the form of a graph. The relationship represents the pairwise relation and represents structural characteristics of entities of a graph.

Various algorithms are available to find the right solution for the business problem. That also depends on the nature and severity of the problem. The organizations use the graphs to gain insights that can be made use of in the case of marketing. The best example is to analyze the social networks or in the case of the Telecom industry to operate fixed or mobile networks which can be represented as a graph. Customers talk to one another and that relationship forms the graph.
In Graph analytics, many different types of graphs are there For example directed graph, undirected graph, weighted graph, and cyclic graph based on how the different entities are connected to each other. In the case of a directed graph, all the edges are connected directed from one node to another. It represents asymmetric relationships. In the case of an undirected graph, all the edges are connected from one node to another but the direction of the relationships is not drawn. This type of graphs represents symmetric relationships. In the case of weighted graphs, all the edges have numerical weights assigned to them. Which is required for the shortest route problems and as well in terms of other analysis. The last type is Cyclic Graph. In this case of the graph will have a path from at least one node back to itself.
Graph analytics have a wide range of applications that includes fraud detection-Graph Analytics is used to find out the fraud detection in the industry that involves financial institutions, telecom companies, and e-commerce which works with networks. Secondly, in social media analysis- social media networks like Facebook, LinkedIn, and Instagram are connection-driven applications Graph Analytics is capable of identifying influencers and communities on social media networks. The third one is resource management- Under this, Graphical analytics has applications such as network analysis to optimize the use of basic facilities like water, electricity as well as in terms of logistics to optimize routes. Money laundering and financial fraud-A technology have appeared that is Graph analytics by visually connecting the customers and parties with some basic details the Graph analytics can perform some holistic customer profiles and is also capable of doing the financial crime detection.
Businesses are increasingly using technology to speed up data presentation. Once the data science specialist can visualize the connections, then it is easy to create an algorithm use statistical analysis, machine learning to analyze the data that improves the accuracy.
Prof.Roopa U
Assistant Professor,
DSCE-MBA
